

Marketplace Metrics: Funnel, Segmentation, and Retention
This project analyzes data from Olist, a major Brazilian e-commerce marketplace, to determine exactly how delivery delays and review scores impact customer retention. While most analyses look at general sales trends, this database project specifically isolates one-time buyers versus repeat customers. By mapping the direct financial and behavioral impact of shipping bottlenecks, the final insights provide a data-driven roadmap for leadership—proving exactly where optimizing logistics will yield the highest return on investment (ROI), and where allocating resources would be a waste of time.
problem
This project addresses the operational and strategic challenges faced by Olist. Olist is a marketplace that connects multiple sellers to customers. In a model similar to Amazon, a single customer order may contain products from multiple independent sellers, creating complexity in logistics and performance tracking. This database project is designed to solve critical business problems, specifically: identifying strategies to increase seller sales and customer satisfaction, optimizing logistics to reduce delivery delays, improving the overall customer experience to mitigate negative reviews, and providing granular tracking of merchant performance and inventory.
Methods
Database Architecture & Data Integrity
The analytical framework is built on a relational schema in PostgreSQL, chosen for its optimization of complex window functions and analytical queries.
Schema Overview & Relationships: The architecture is structured as a star-like relational schema centered around the
orderstable, which serves as the primary link for transaction-based data across nine distinct entities:The
orderstable connects tocustomersviacustomer_id, and maps toorder_items,order_payments, andorder_reviewsviaorder_id.The
order_itemstable serves as a relational bridge, connecting individual orders toproducts(viaproduct_id) andsellers(viaseller_id).The
productstable maps toproduct_category_name_translationto localize Portuguese categories into English.The
geolocationtable joins to bothcustomersandsellersvia zip code prefixes to enable spatial logistics analysis.
Data Integrity & Cleaning Strategy: Strict Primary Key (PK) and Foreign Key (FK) constraints were enforced at the schema level to maintain referential integrity and prevent orphaned records. Text encoding anomalies in Brazilian Portuguese and inconsistent date formats were cleaned directly within PostgreSQL using DDL and DML statements. Raw
NULLvalues were intentionally preserved to maintain dataset integrity but were handled programmatically during analysis via conditional logic (COALESCEandCASE WHEN) to prevent skewing operational metrics.
Analytics & Statistical Pipeline
To move from raw database manipulation to advanced statistical inference, the clean PostgreSQL data was ingested into R using the DBI and RPostgreSQL libraries. The tidyverse ecosystem was utilized for data manipulation, and data frames were visualized using ggplot2.
Because e-commerce data often exhibits non-normal distributions and uneven cohort sizes, the following statistical pipeline was deployed to evaluate the metrics:
Fisher’s Exact Test: Deployed to analyze discrete categorical cohorts (delayed vs. on-time) because initial Chi-Square approximations threatened inaccuracy due to small cell counts in specific repeat-buyer segments.
Logistic Regression: Executed using delivery delay days as a continuous numeric predictor to evaluate the probability of a customer becoming a repeat buyer without losing granularity to arbitrary bucket boundaries.
Kruskal-Wallis Test: Utilized to compare the distribution of review scores across different delivery groups, accounting for the ordinal (1–5) and highly skewed nature of customer ratings.
Spearman Rank Correlation: Applied instead of Pearson to assess the monotonic relationship between total transit days and review scores without assuming normal distribution or strict linearity.
Linear Regression: Run to isolate and quantify the exact marginal effect of each additional transit day on a customer's review score.
Findings and Recommendations
Finding 1: Logistics Impacts Satisfaction, But It Isn't the Sole Driver
The data proves a statistically significant, negative relationship between delivery timelines and customer sentiment. While initial high-level visualizations may suggest an exaggerated drop-off, linear regression reveals a more measured, continuous decay: each additional day of delivery delay reduces a customer’s review score by ~0.034 points (p < 0.001).
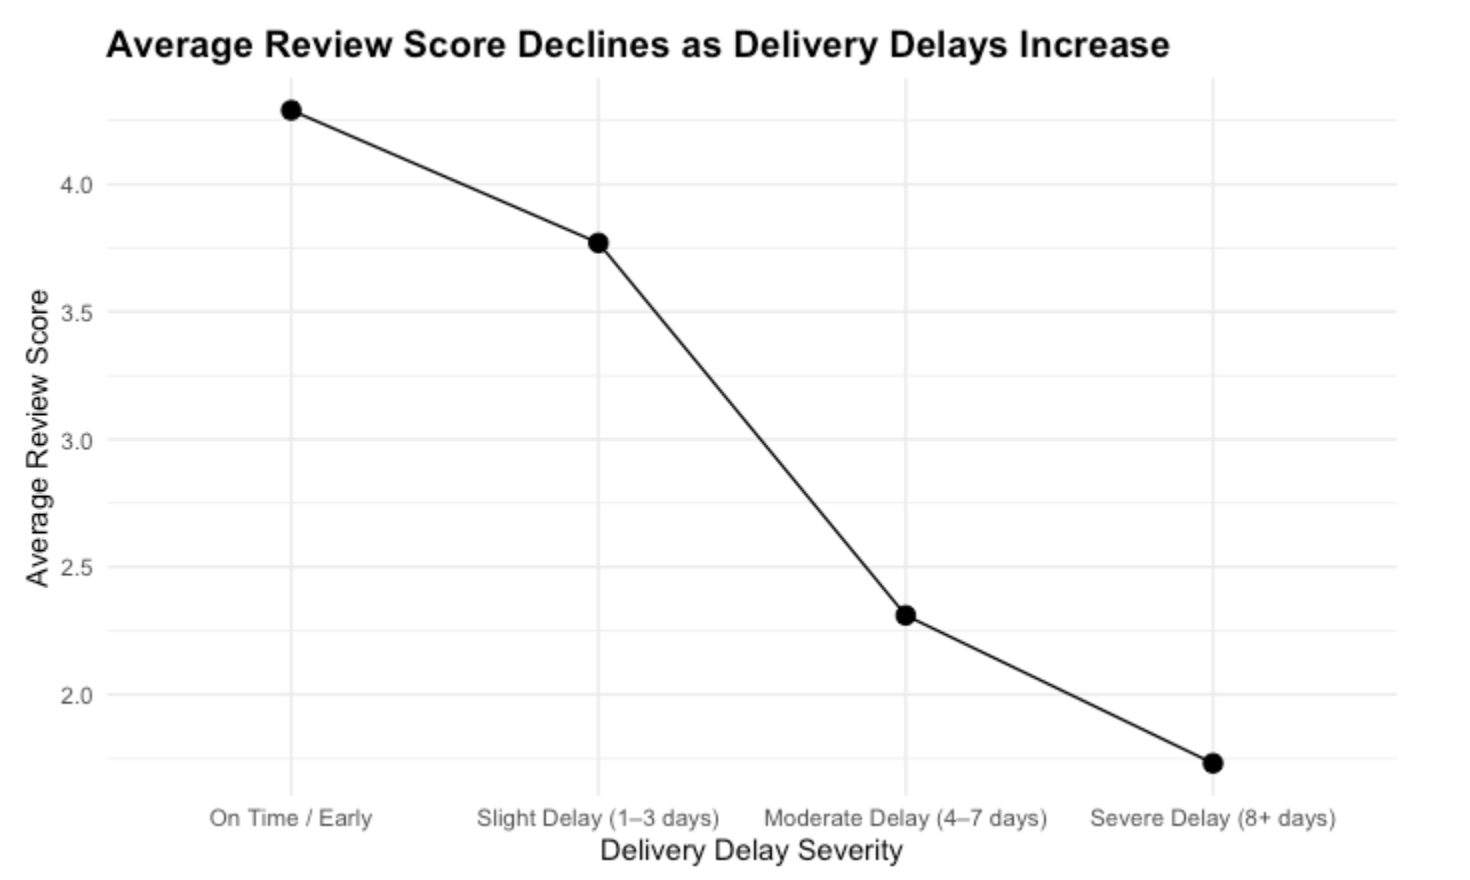
Spearman correlation and regression metrics indicate that while this downward trend is highly certain, it is a weak relationship—delivery delays explain only ~7% of the total variation in customer ratings (R² = 0.07). For example, a severe 10-day delay only drops a score by ~0.34 points on average, indicating that product quality, pricing, and expectations heavily dictate the remaining 93% of customer satisfaction.
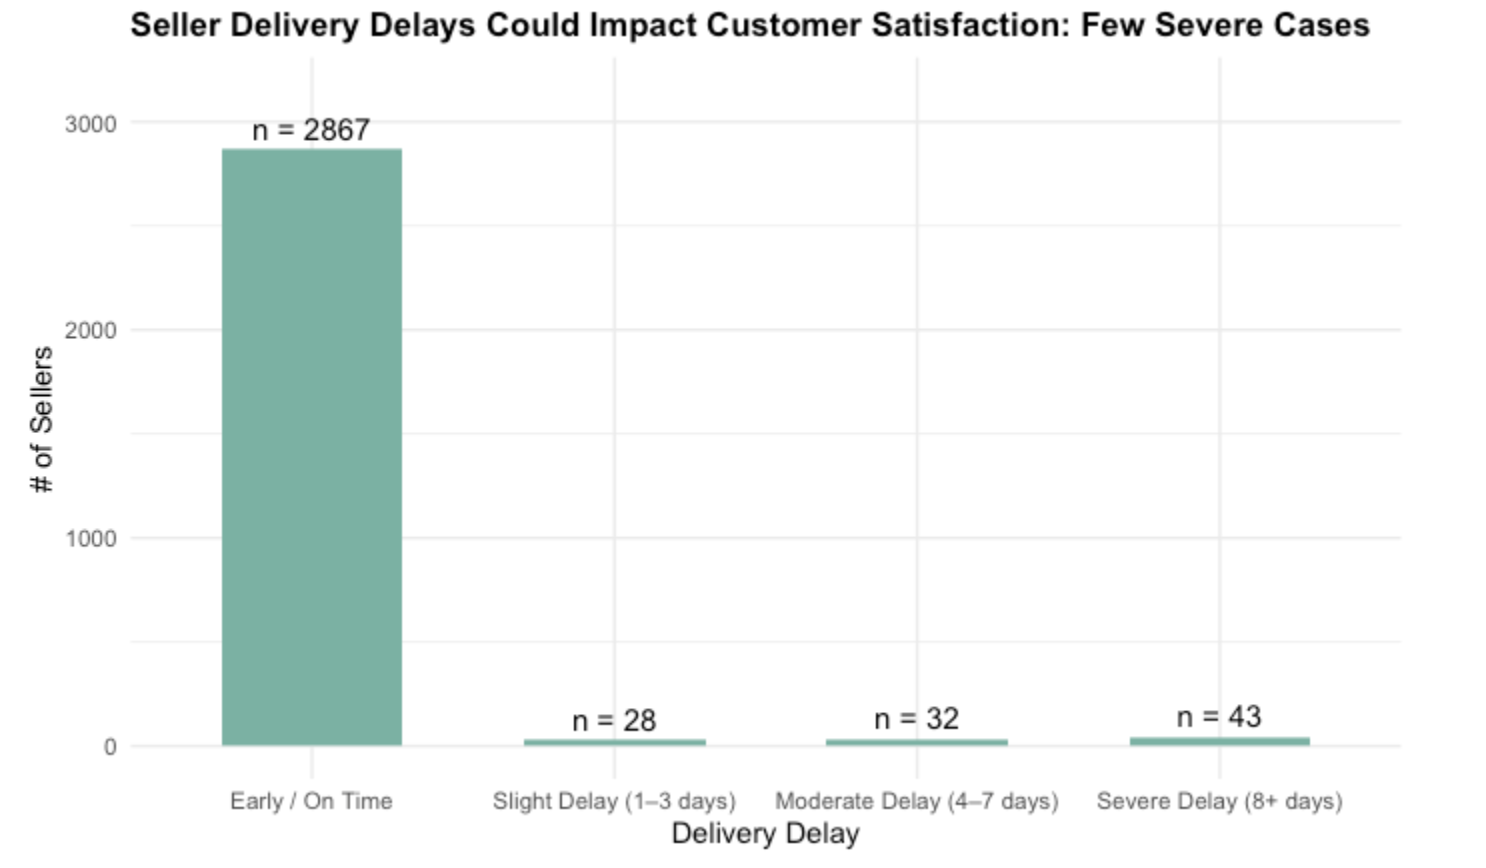
Furthermore, a Kruskal-Wallis test confirmed that there is no sharp, sudden breaking point where review scores instantly plummet across delivery buckets; the drop is continuous, and extreme delays are statistical outliers within the ecosystem.
Finding 2: The Retention Paradox – Delays Don't Drive Churn
When analyzing retention through a high-level categorical lens, Fisher’s Exact Test shows no statistically significant association between a binary delivery delay and repeat purchasing behavior. However, scaling to a continuous logistic regression model uncovers a highly nuanced truth:
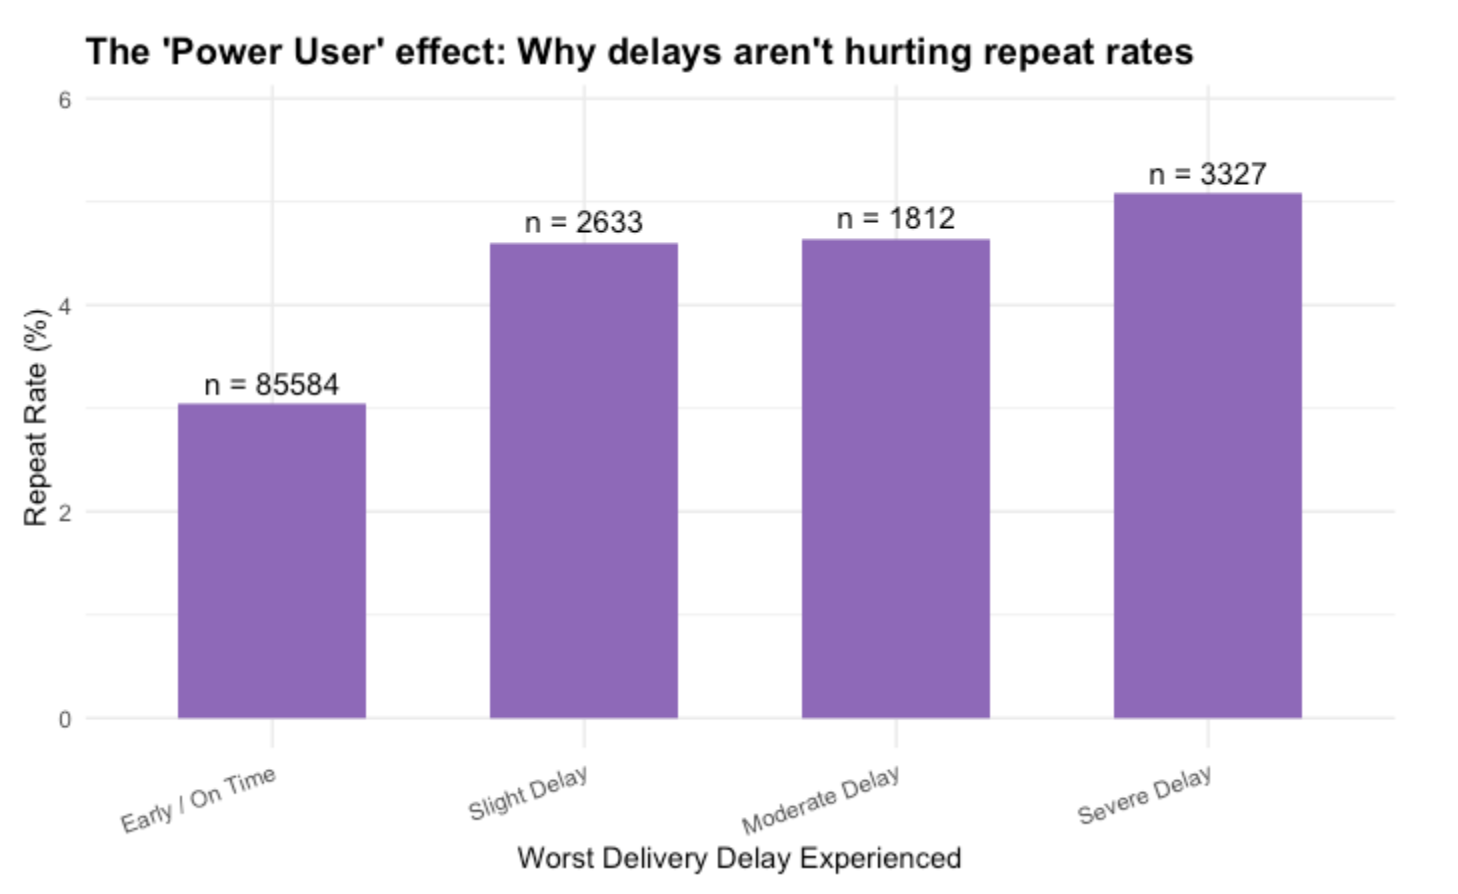
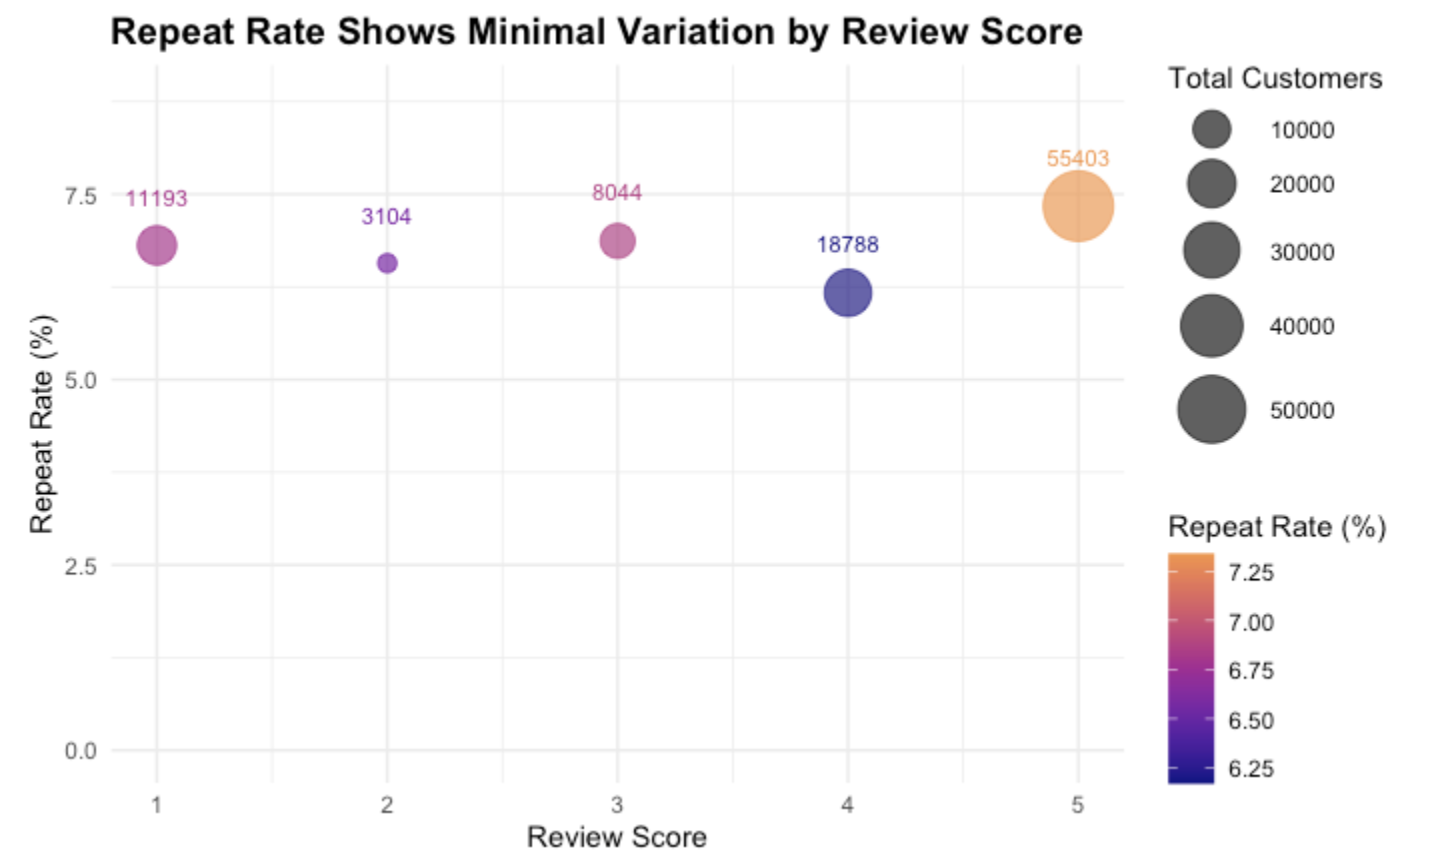
If an order is delivered fully on time, the baseline probability of a customer making a repeat purchase on the platform is low, sitting at 6.1%. Each additional day of delay reduces the odds of a repeat purchase by a modest 0.85% per day. While statistically significant due to the massive sample size, the actual economic effect size is remarkably small. Delivery speed contributes slightly to retention, but a poor delivery experience or a low review score does not automatically mean a lost customer for the marketplace as a whole.
Finding 3: Delays are Macro-Geographic, Not Just Seller-Specific
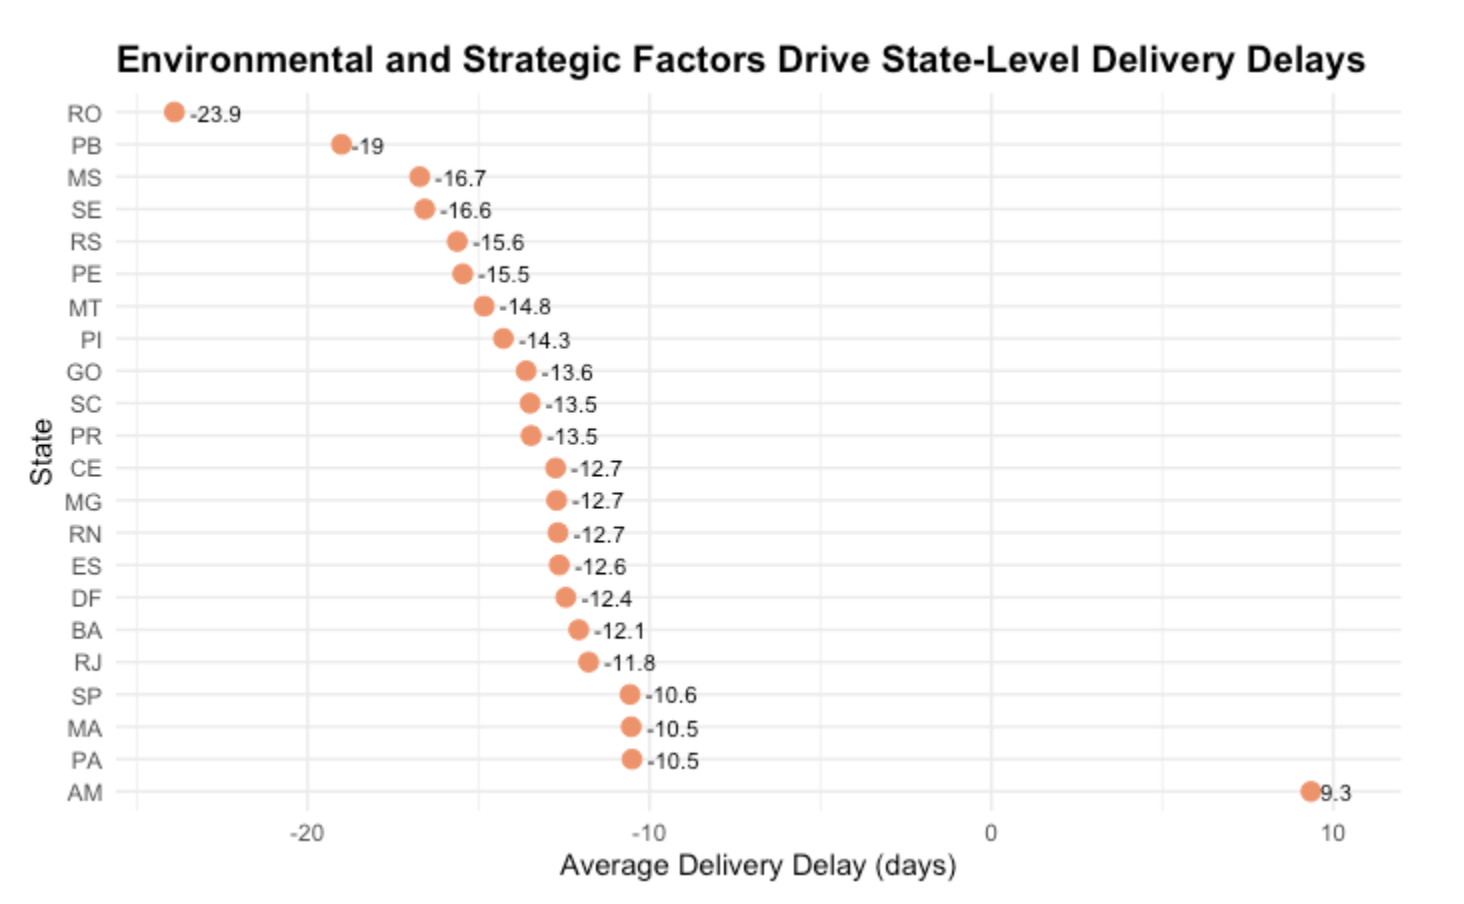
Evaluating geographic and seller performance reveals that the largest delivery delays (relative to the estimated delivery date) are heavily concentrated in specific Brazilian states and transit corridors. The statistics indicate that operational bottlenecks are primarily driven by regional infrastructure and environmental logistics factors, rather than isolated poor performance by individual sellers.
Strategic Recommendations
Based on these statistical insights, Olist leadership should optimize resource allocation by shifting from a general "speed-at-all-costs" mindset to a targeted, high-ROI mitigation strategy:
STOP: Blanket Shipping Speed Initiatives (A Waste of Resources)
Do not allocate heavy capital to expensive, platform-wide logistics initiatives aimed at shaving a few days off standard delivery timelines. Because a 1-day delay only decreases retention odds by a tiny 0.85% and drops review scores by a negligible 0.03 points, a blanket shipping acceleration program will yield an exceptionally poor ROI.
INVEST: Regional Logistics & Infrastructure Optimization
Direct capital exclusively toward resolving the macro-regional bottlenecks identified in high-delay Brazilian states. Partnering with regional freight operators to smooth out systemic transit corridors is the most effective physical intervention to protect the platform's public review reputation.
INVEST: Data-Driven Expectation Management
Since delivery delay only accounts for 7% of review variance, customer satisfaction is heavily tied to expectation rather than raw speed. Invest in predictive machine learning models to provide more conservative, accurate delivery windows at checkout. Adjusting customer expectations via software is a low-cost, high-return fix that mitigates negative reviews without altering physical supply chains.