

**Disclaimer: Some details of this project will not appear in this case study because they are intellectual property. You may gain access to the full case study upon request at the discretion of the author. Please contact lkanaventi1020@gmail.com for password.
Status tracker hub
The credit card business line wanted to create a status tracking hub for a variety of tasks such as tracking the progress of a new credit card application, credit line increase application, balance transfer, and fraud/dispute claim. After talking to a variety of stakeholders and leaders in this space I wanted to conduct the research to include different types of credit cards, different segments of customers (small business, consumer, wealth) that might have different needs, and customers that have multiple types of accounts to ensure this status tracking hub will work for non-credit card related tasks in the future. I wanted to find out what is happening today, and how we might be able to improve upon that.
Problem
The goal: Move a “call-only” process into a digital hub that gets information to users quickly and saves the bank money. Before this project, there was no digital way for customers to track things like credit card applications, or fraud claims. If you wanted an update, you had to call in.
The Real-World Mess:
The “Black Box” Problem: 80% of customers got an instant decision, but the other 20% were left in limbo. Even worse, 40% of people were actually denied, but because of regulations, we just told them their aplication was “under review.”
The Phone Loop: Since the messages were vague, many called customer support. The agents couldn’t tell them much more which frustrated everyone and drove up costs for the bank.
The Paper Trail: We were still relying on physical mail for documents, which made everything feel slow and tedious.
Methods
I used a mixed-methods approach to move this project from an analog “black box” to a high-performing digital hub. I combined qualitative discovery with advanced data modeling to navigate a complex environment with competing labels and high stakeholder stakes.
Qualitative Discovery and Requirement Gathering
I started by understanding the “why” behind the problem. I interviewed business leads to understand what the current process is and their understanding of what isn’t working for the bank and customers.
Stakeholder interviews: I met with leaders to define the functional scope - specifically the need for a scalable hub for Consumer, Small Business, and Wealth segments. I then presented my proposed research to the Chief Customer Experience Officer to ensure high-level buy-in.
Discovery moderated user interviews: I conducted discovery interviews to define what the user’s problem and needs. This phase was critical for identifying “missing” features like timeline expectations and digital document uploads.
Quantitative Modeling and Navigation Validation
Once I had the requirements, I shifted to quantitative testing to prove which navigation paths would survive the “intent' capture” of other competing dashboard labels.
Tree test (N = 152): I ran a large-scale taxonomy audit to see where users expected these tasks to live. To validate the results, I ran a Chi-Square Test of Independence which proved that a user’s first click choice was the primary driver of their final success.
Moderated usability test: We tested a high-fidelity prototype to assess findability and task completion.
Unmoderated click test and survey: Launched simultaneously with the usability study to re-test entry points and label comprehension.
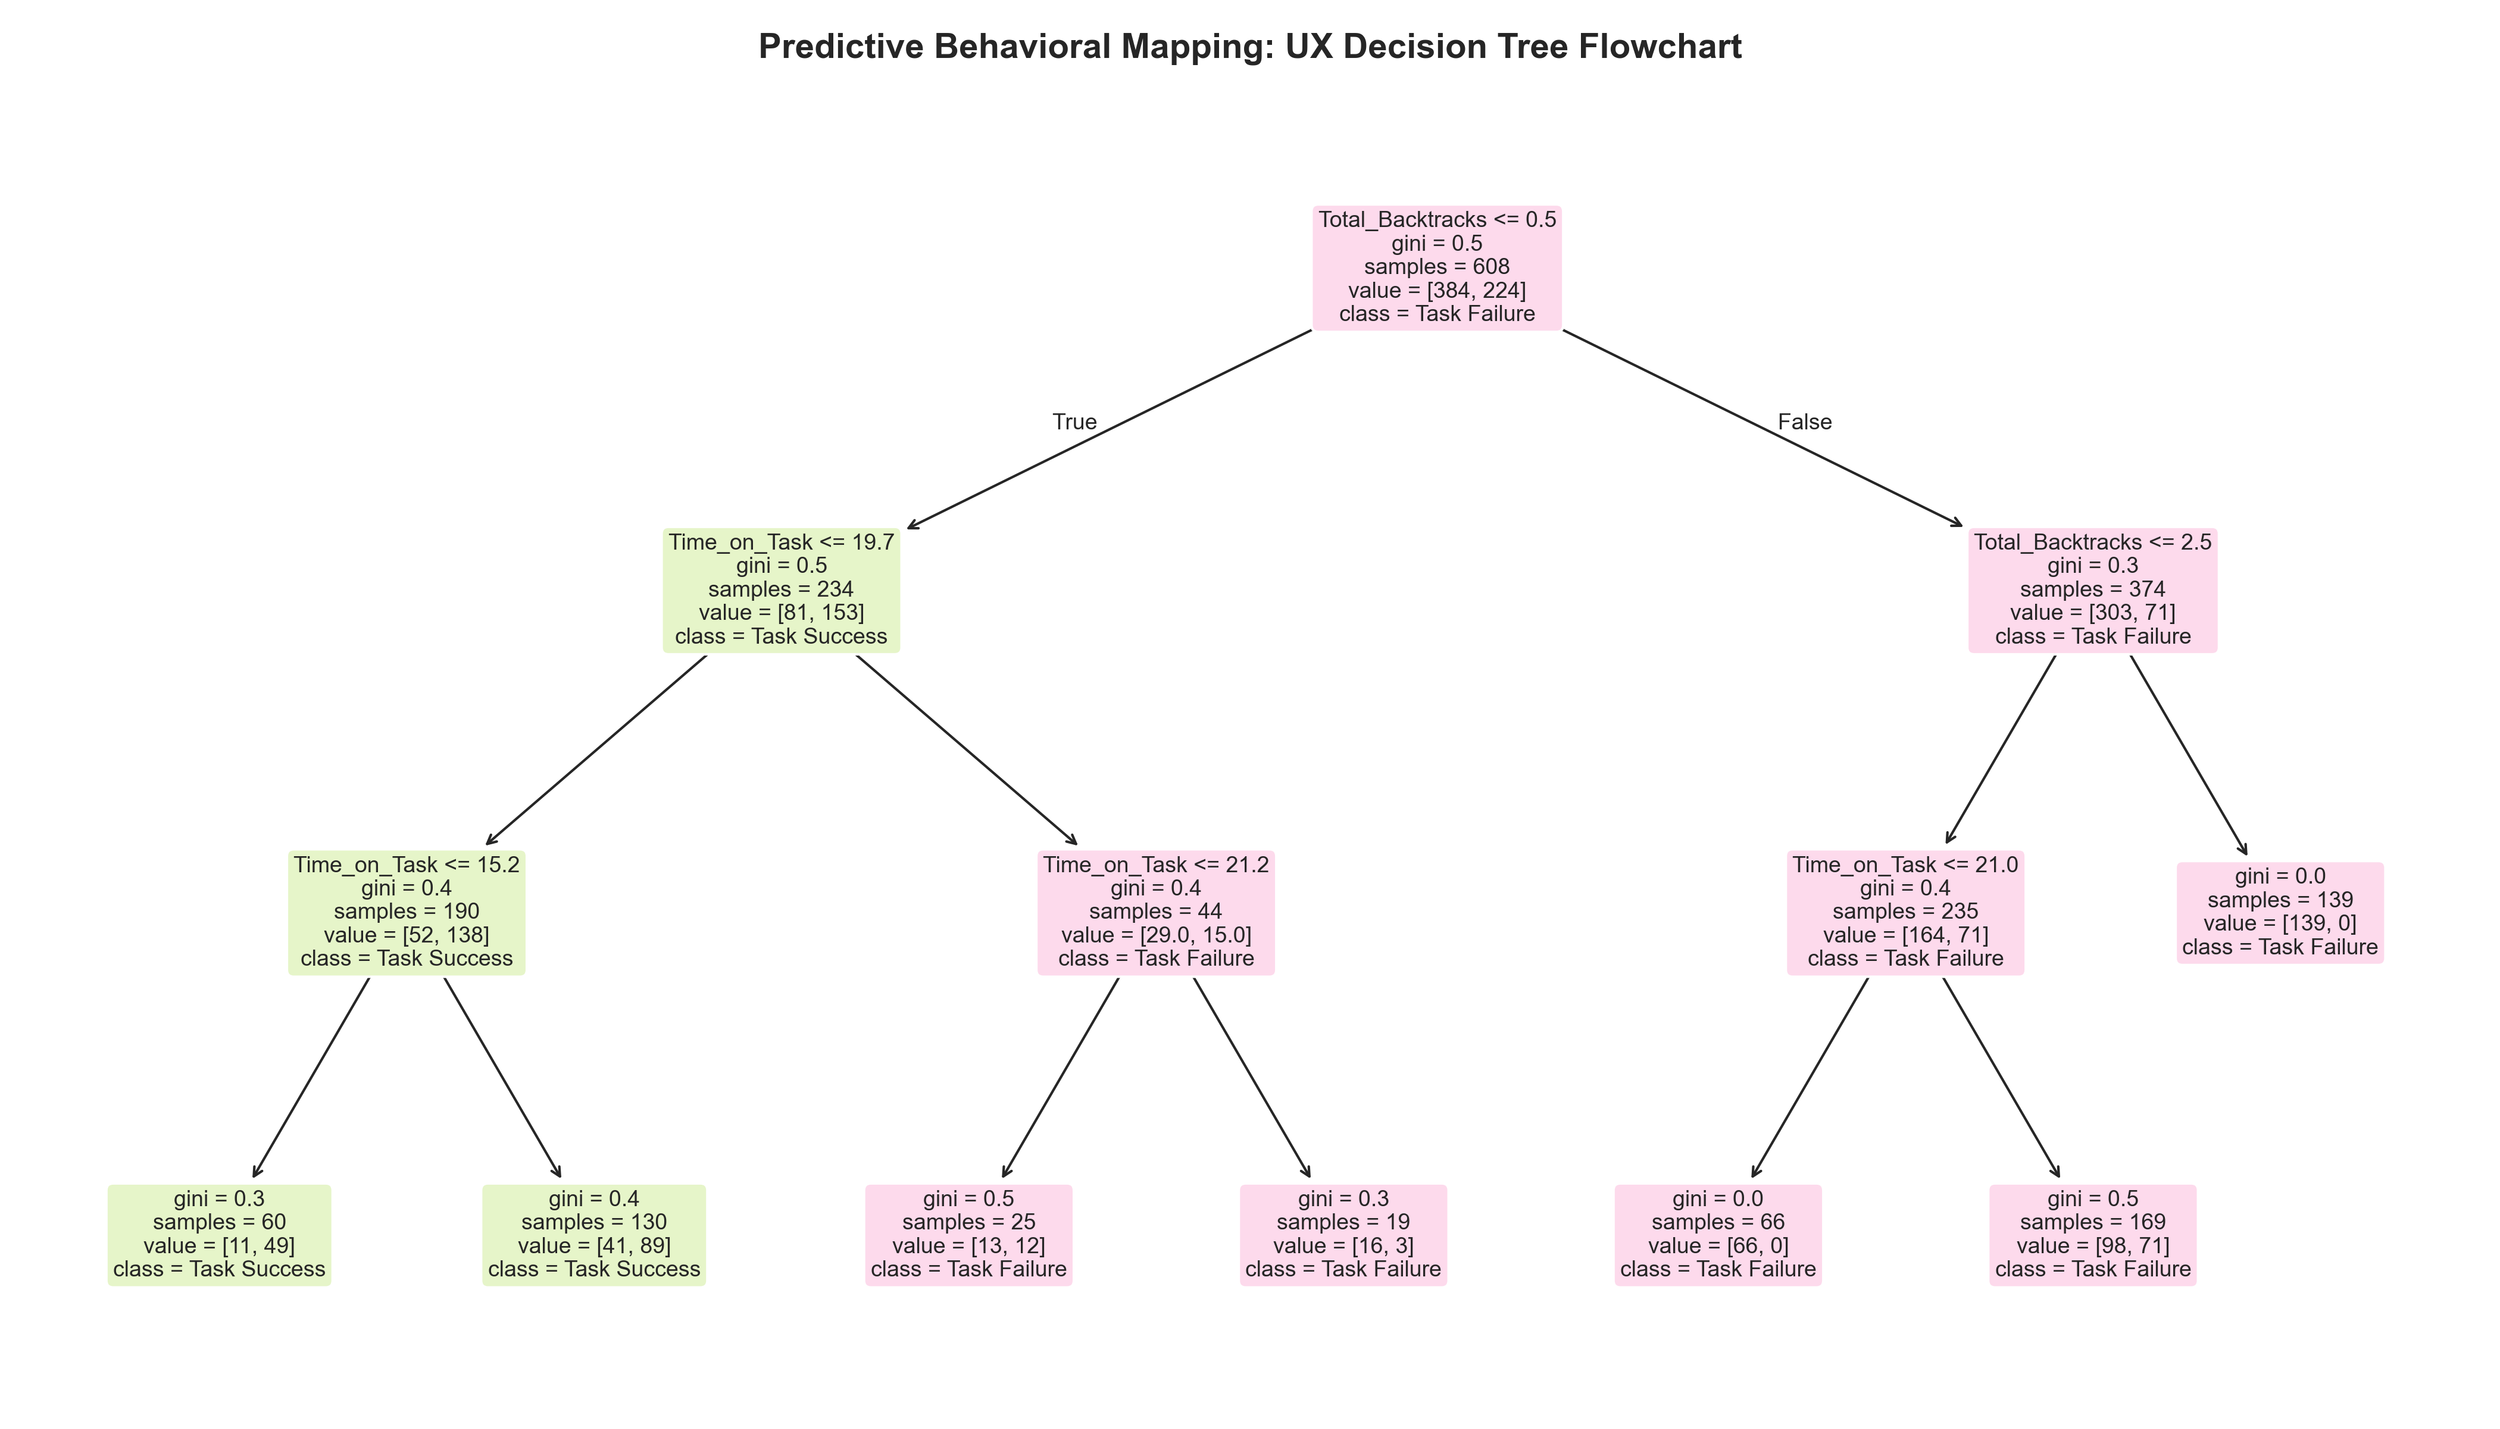
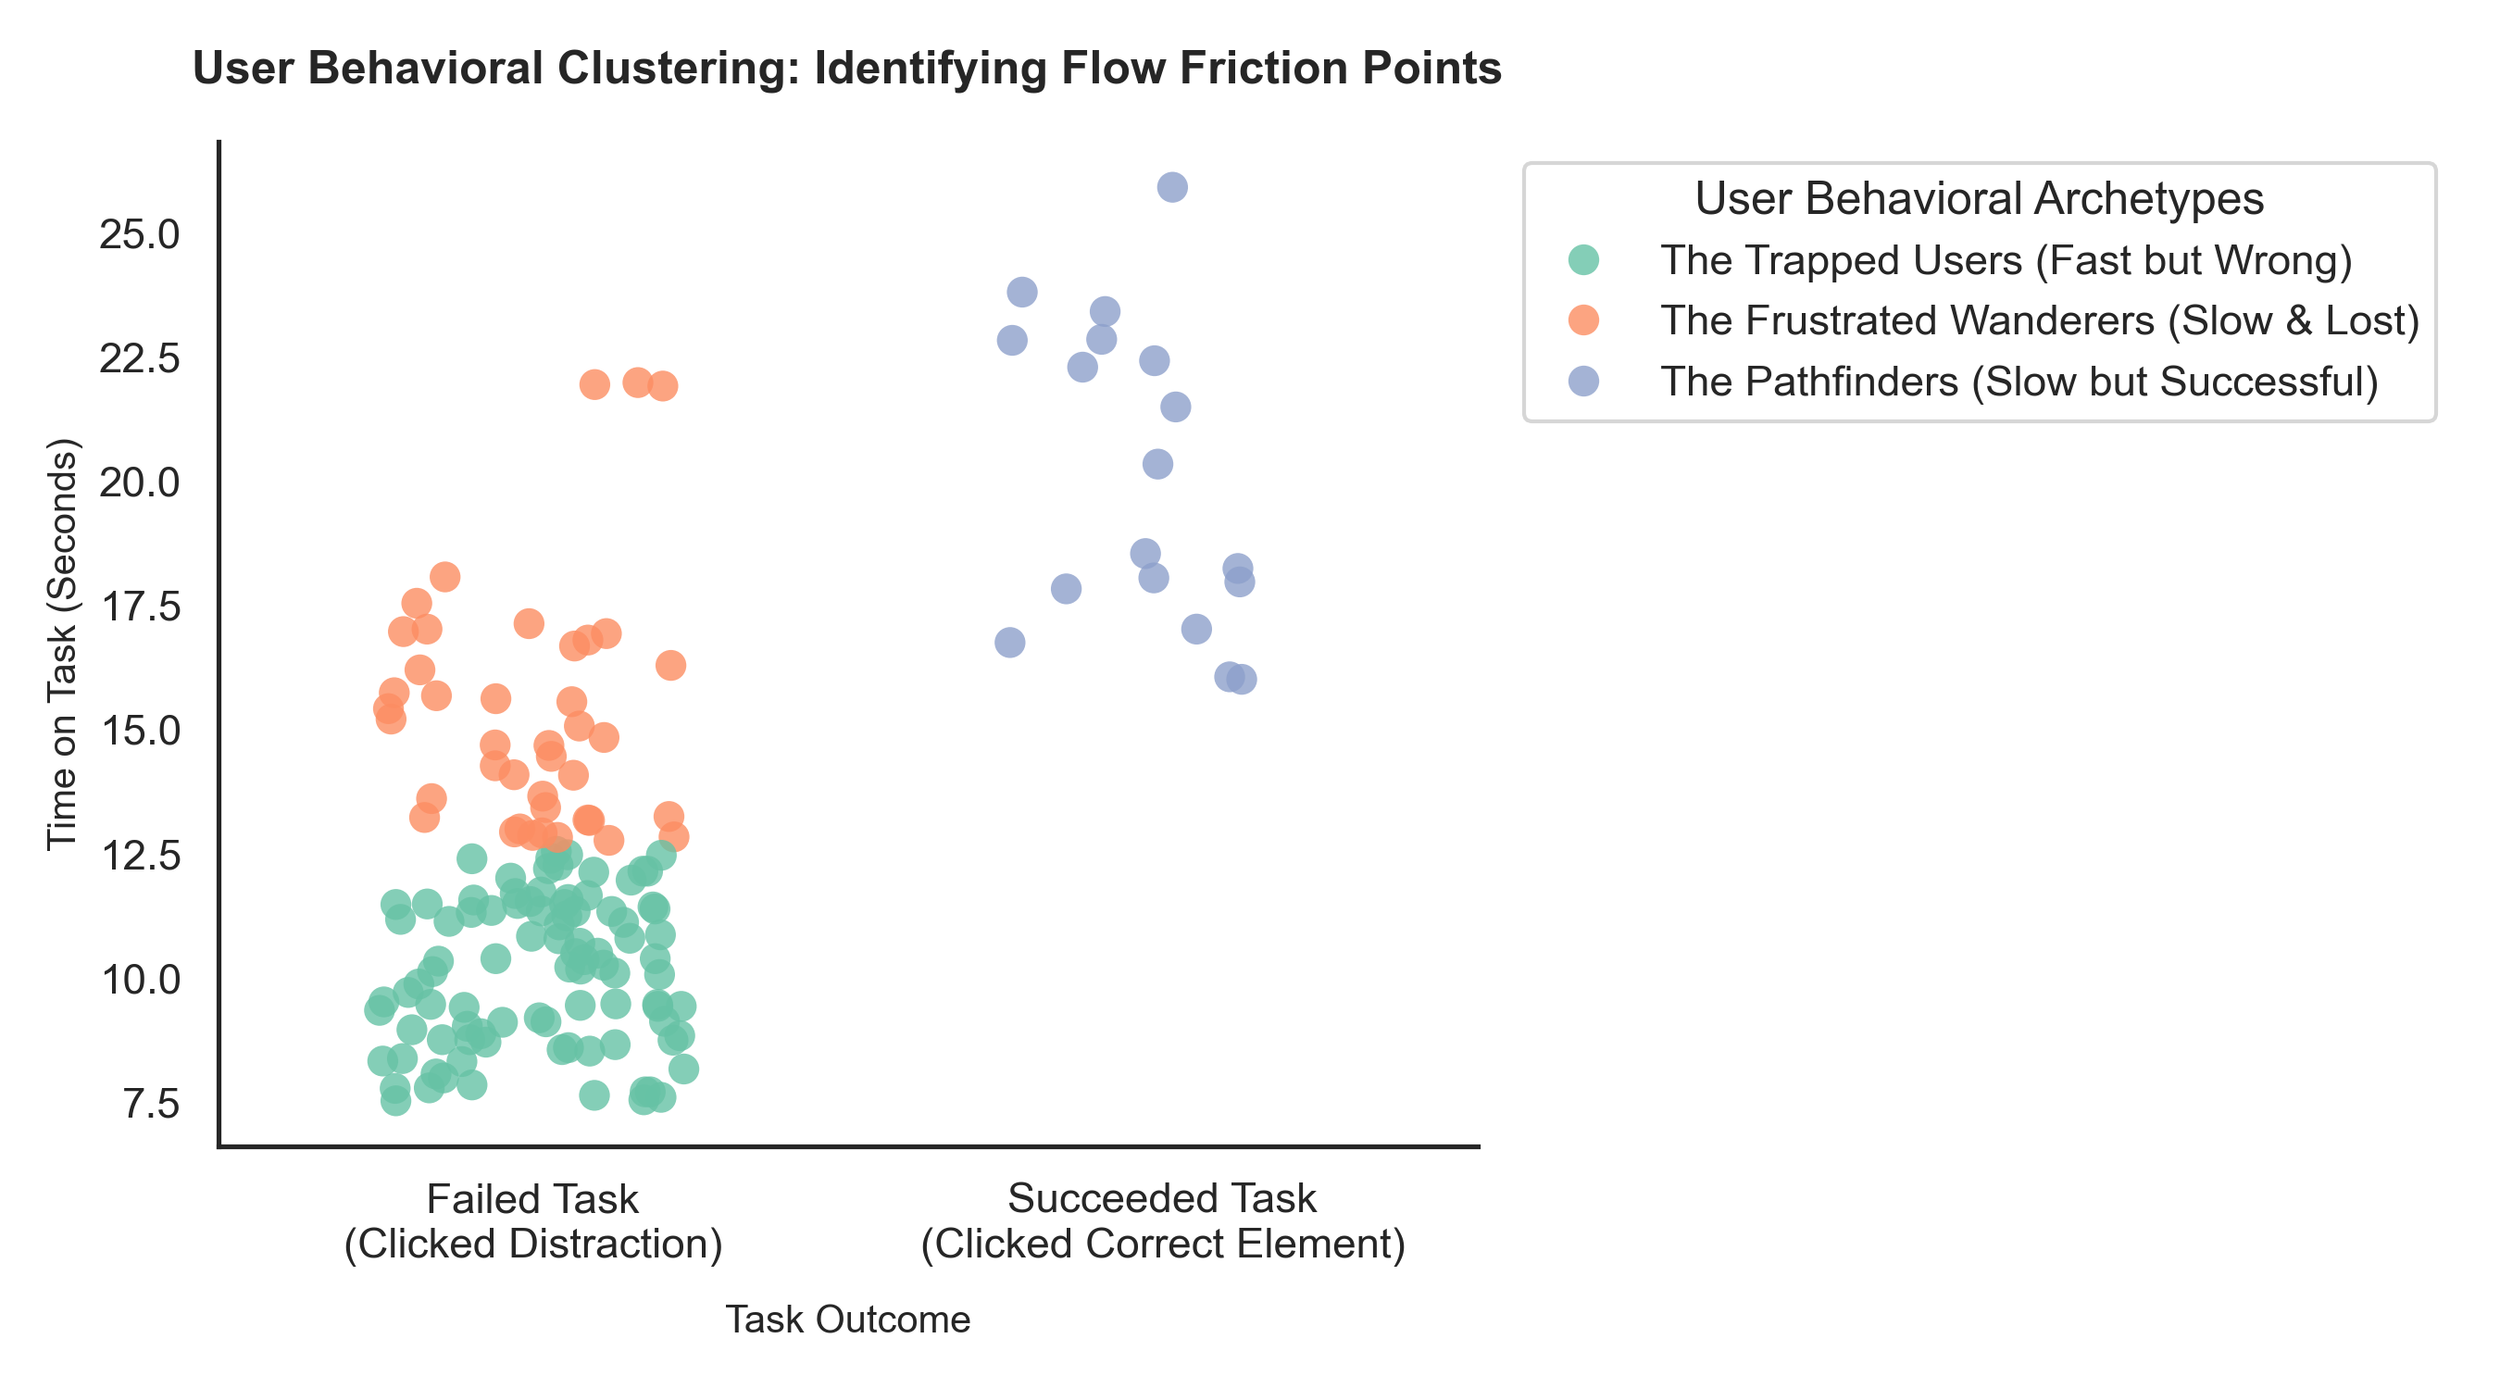
Data Reconstruction and K-Means Clustering: Since I didn’t have access to raw digital logs, I used visual hotspot density weighting to reverse-engineer heatmaps into raw performance metrics. I then applied a k-means clustering algorithm to segment the N = 152 participants into behavioral archetypes (like “Trapped Users” who were fast but wrong) to prove how competing dashboard labels were hijacking user intent.
Predictive Failure Mapping: Finally, I used a Decision Tree Classifier to isolate the “Frustration Threshold” - identifying exactly when a user’s probability of success dropped proving that if a user didn’t find the hub within the first few seconds, they were likely “trapped” by a competing label.
Findings and recommendations
Discovery: Moderated User Interviews
The hub concept was a challenge because user’s had no mental model of this concept. User’s thought it was “innovative,” but had no pre-existing expectation of where to find it. The interviews defined the functional requirements for a centralized, multi-account experience.
Navigation: Tree Test
To solve the location confusion, I used a Chi-Square Test of Independence (X² = 330.12, p < 0.001) to prove that a user’s first click was the primary predictor of their final success.
The Predictive Failure Model
I trained a Decision Tree Classifier to map exactly where the navigation friction becomes terminal. The model isolated a critical threshold: once a user spends too much time on a single menu, the probability of failure spikes, signaling visual fatigue.
Validation: Moderated Usability Test and Click Test/Survey
For the final prototype, I reverse-engineered the heatmaps into raw metrics and applied machine learning to segment user behavior.
Behavioral Archetypes (K-Means Clustering)
Instead of just looking at averages, I used a K-Means algorithm to the original test data to see if I could mathematically isolate “Trapped Users.” This proved that the confusion we saw in person was actually a predictable behavioral archetype caused by competing labels. I found three distinct archetypes based on their speed and accuracy.
Business Impact: A Case for Quantitative Advocacy
By applying these models retrospectively, I was able to show how Data Science can break a stakeholder “tie.”
The Lesson: During the project, we faced resistance on the “Plan and Track” label. My later analysis proved that we had the data to “win” that argument mathematically.
The Pivot: I showed that the “Dashboard Shortcuts” were a viable “Path B” because the data science model confirmed they bypassed the specific “traps” that were capturing user intent.
This work resulted in 1million statuses sent and 419,843 customer-initiated document uploads!